Strava

Playing with StatsHunters

Today I saw a link to Stats Hunters on the Google App so I clicked through on a laptop, once I was sitting at a computer. This is an app that looks at Strava data and gives you a summary of how many activities you’ve done as well as how far you have travelled. 

According to the data this Strava add on can access I have 2753 logged activities with a total distance of 25,l404 kilometres. November 2018 was my best month with 898 kilometres travelled. I think this was kilometres ridden on Zwift if I remember correctly. 

A Lot of Walking in Circles

People think that you need to get in the car, drive for half an hour to two hours, hike, and then drive home for from half an hour to two hours but this idea is wrong. We can do a lot of walking in circles. In reality we don’t walk in circles. We walk in loops. We walk from home to home, but via a different variety of villages. Some days it is the villages that overlook the lake, and other days it is the villages that are under the Jura.

The Slowness of Public Transport

Today someone something to the effect “If I go from here to there it will take me two and a half hours so it would require a car.” That’s what I have been saying for years. That’s one of the reasons for which having a sporty life, during the pandemic, is not possible, or at least requires a much bigger commitment.

Summer sporting activities are vulnerable because in times of pandemics car sharing is no longer possible, and is no longer advisable. If you’re in a car for an hour or two each way then the mask will not protect you effectively, especially if the windows are closed. Trains used to have windows that you could open. Now that they don’t their allure is diminished during such times.

I Completed the Apple May Activity Challenge Yesterday

I completed the Apple May Activity Challenge yesterday. The goal was to walk or run 349 kilometres within one month. I finished this challenge two days early.

Using the Apple Watch Series 3 and the SUUNTO Spartan Sport Wrist HR BARO I tracked all of my activities. For the first two or three weeks I tracked activities with both devices and then deleted the duplicates on Strava and then I stopped tracking with the Apple Watch as I saw that activity data could be communicated to Apple’s Activity tracking.

Strava - The Escape Plan

Strava - The Escape plan has the goal of getting people to move 15 minutes a day 5 times a week for four weeks. This includes all sports from Alpine Skiing to Yoga with walking, hiking, kayaking, cycling, swimming and more. In other words your walk to the shops, the café and the work commute are included.

With so many sports activities included in this challenge, it should be easy for everyone to achieve. You could walk to work the first day, cycle the second, swim in the evening on the third, play on one of the elliptical machines on the fourth and follow a yoga session on the fifth. There is no reason not to succeed. As I look through the list every one of these sports would be practised for extended periods of time beyond just 15 minutes. I can’t see many people going for a fifteen-minute hike. I would expect it to be for longer.

Cropping an activity on Strava

When you’re hiking, cycling, climbing or doing other sporting activities it is easy to forget to stop tracking an activity. When you’re at home or static this is less critical. When you get into a car after a hike or other activity that mistake will screw up your average speed and other data.

Yesterday I realised that I had forgotten to stop tracking on my Suunto device and on my apple watch. With the Apple watch this was less important because it logs individual climbs. With the Suunto device however it tracks the speed of the drive as well as the increase and decrease in altitude.

Wordpress and Strava - Using WP Strava on this blog

I installed WP Strava on this blog to share my Strava cycling and running activity. At the time of this blog post you can see my most recent bike rides in the left column as well as the most recent map. With a minimum of code you can also include your bike rides within a post like you see below. You write activity id=number of activity and the ride will be integrated within your blog posts without the need for embed codes and an iframe. [activity id=1026494012] This is useful for activity bloggers such as myself. The code is simple and easy to remember, as soon as I find the right keyboard keys to avoid the need to copy and paste. Shortcodes are to add information to blog posts and the widgets are for the side bar. SHORTCODES activity id=NUMBER – add to any page or post. Also takes the following optional parameters:

Strava Now Has Rock Climbing, Hiking And More

David - First of May 2018

Hey Richard. I actually built an app to solve this problem. I’m a climber and a runner and I wanted to be able to track my climbing and see all my exercise in one place. You can log your indoor climbs in the app and it lets you enter the grade, how many tops you completed and tailors everything to the specific gym you’re in. There’s no outdoor climbing yet but it’s planned for the future. Check it out on https://www.clamberapp.com if you think it will help you.

Strava Now Has Rock Climbing, Hiking And More

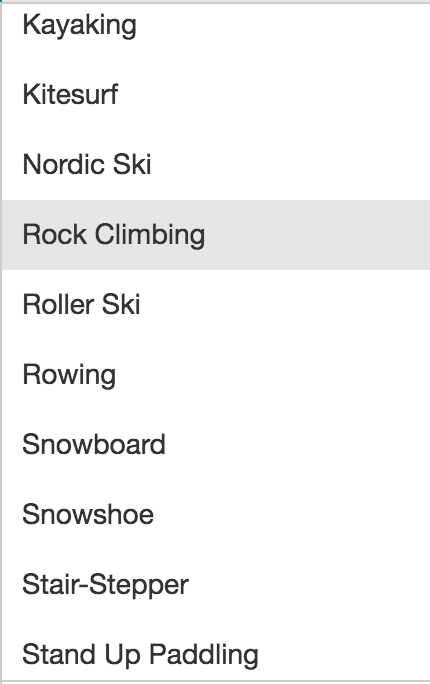
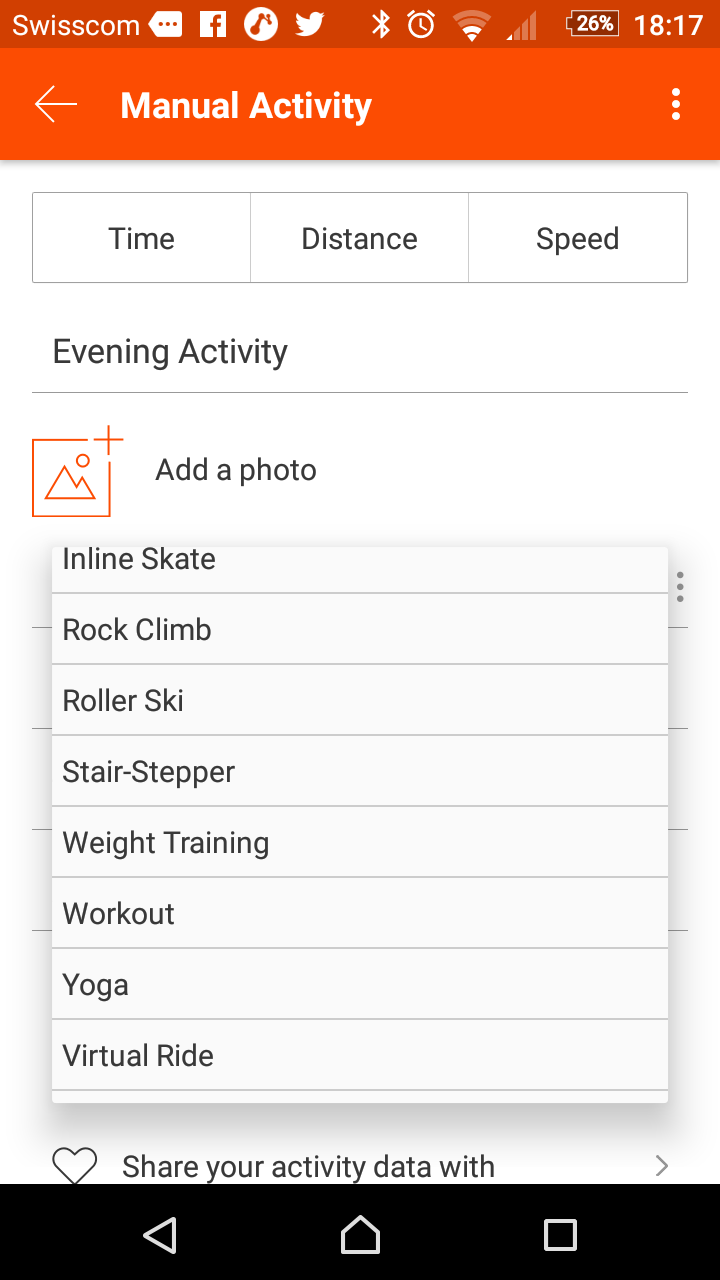
Strava now has rock climbing, hiking and many more sports. Sports tracker, movescount and other applications already allowed you to do this but it is nice to see one more network provide us with this option. [caption id=“attachment_3340” align=“aligncenter” width=“189”]Strava expanded the number of sports you can track Strava expanded the number of sports you can track[/caption] Up until now I had to make sure to go for a bike ride or three per week to keep people updated on what I did. During week days I am likely to go for bike rides. On two to three evenings per week I may go climbing and on the weekend I may go hiking or for a walk. As a result I can track the diversity of my activities. [caption id=“attachment_3341” align=“aligncenter” width=“169”]Strava has updated the list of sports Strava has updated the list of sports[/caption] With rock climbing I would like them to add two or three more fields. I would like them to add an option to add the grade of the climb we did. This would need to use the European and the American systems. It would help us track our progress and even track how hard we worked if we’re wearing a heart monitor as we climb. In effect it could provide us with a way of seeing who else is climbing and whether we match their skill level. In the long run this could contribute to new groups. I have created a group for Swiss Via Ferrata in anticipation of via ferrata practitioners joining the network and sharing their climbs. Until recently I would only track cycling and running. Now that walking, hiking and climbing have been added I can track a number of new sports. It should result in people using the app more frequently.  It could be fun to see climbing and hiking heat maps. We will see how they adapt the input section to match the sports.

StravistiX for Strava

StravistiX for Strava

Stravistix for strava is a Chrome plugin. It allows you to analyse the data from your ride in more detail and with more graphs. In the detailed view you can see heart rate information, speed, power, grade, elevation and  ascent speed. It allows you to see each metric in more depth. It allows you to look at your statistics in detail. You can see what percentage of the ride was flat, uphill or downhill. You can see how fast you were climbing and how your speed varies. [gallery columns=“4” ids=“2707,2708,2709,2710,2711,2712,2713”] This breadth of data is fun to play with. It allows you to see whether you do spend as much time as you thought climbing. It also allows you to see how much of your time was spent static or moving. There is a weather module for wind, temperature, clouds and humidity. This is a nice way of checking whether the wind is favourable to the ride you are thinking of doing that day. What I would like to see next is a log of the weather and especially wind during the ride. It would like to see ground speed in contrast to wind speed. This data should be relatively easy to acquire. Plugins are great because they allow you to do more with the data that you or other people generate. They allow weekend and professional riders to analyse how they are progressing. It also allows riders to compare themselves with others.